
Introduction

At a glance: - A conversion audit identifies the obstacles preventing visitors from becoming customers. It focuses on precisely analyzing friction in the journey and quickly optimizing key pages. Speed, message quality and segmentation are essential for increasing conversion rates.
A conversion audit (professionally known as a CRO audit, or Conversion Rate Optimisation audit) is a systematic analysis of a website to identify obstacles preventing visitors from becoming customers or leads. For a French microbusiness or SME, this assessment is often the most direct way to increase revenue without spending more on acquisition. Conversion rates vary considerably between sectors: 1.9% in electronics, up to 4.6% in specialist e-commerce, and up to 18% in SaaS for free trials converted into paying customers. These differences show that much of the potential remains untapped on most websites.
What are the key steps in an effective conversion audit?
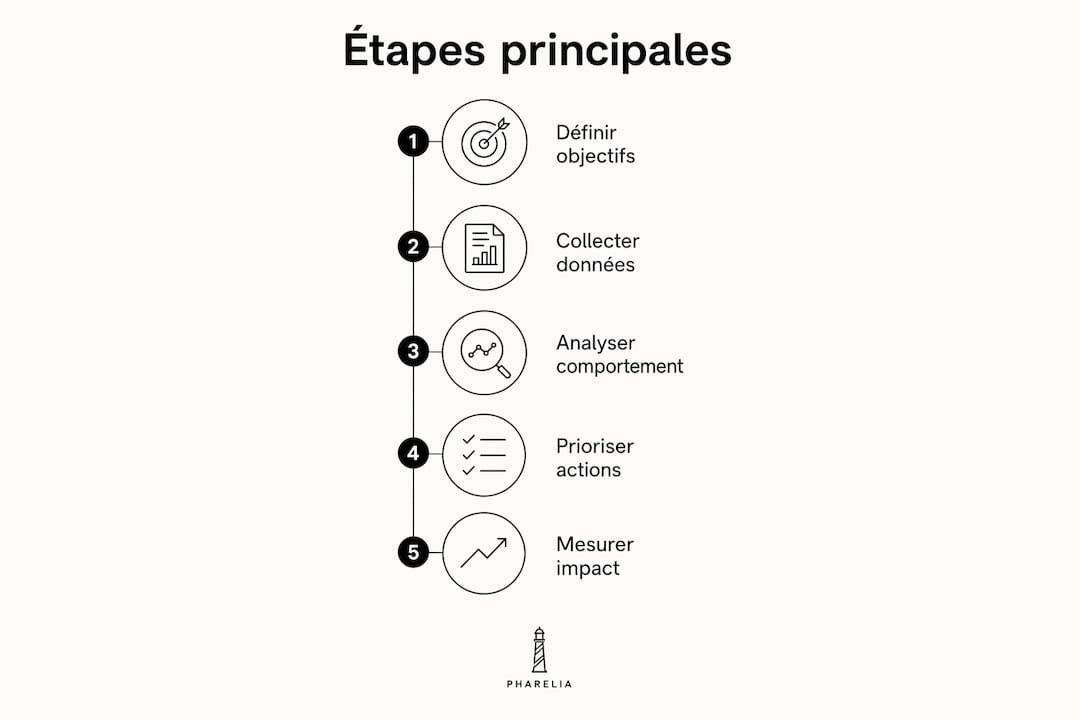
A conversion audit follows a logical progression in five steps. Each step builds on the previous one to create a complete picture of conversion obstacles.
- Define the target conversion precisely. Before any analysis, identify what you are measuring: a purchase, quote request, mailing list signup or phone call. A poorly defined conversion produces unusable data.
- Map the conversion funnel. Trace the visitor's complete path, from the entry page to confirmation. Identify every step where visitors leave the website. The 80/20 rule applies: 80% of conversion problems are concentrated on 20% of pages. This justifies targeted analysis rather than an exhaustive review of the entire website.
- Conduct quantitative analysis. Google Analytics 4 (GA4) provides the basic data: abandonment rates at each step, traffic sources and behavior by device. Add a speed measurement tool such as Lighthouse or PageSpeed Insights to identify slow pages.
- Conduct qualitative analysis. The figures indicate where visitors drop out. Session recordings and heatmaps explain why. Qualitative analysis reveals obstacles that data alone does not show: an ignored button, a form perceived as too long or an ambiguous message.
- Prioritize with an impact/effort matrix. Rank each identified problem along two axes: its potential impact on conversion and the implementation effort. High-impact, low-effort actions come first. An effective audit avoids decision paralysis by quickly isolating these immediate gains before considering more complex tests.
Practical tip: A CRO audit is not a UX audit, although the two overlap. A UX audit assesses the overall experience; a CRO audit measures the direct impact on conversion. A/B tests come after the audit to validate the identified hypotheses, not before.
Which improvements does a conversion audit identify first?
The audit consistently reveals the same categories of friction. Knowing them in advance helps you understand where to focus your attention.
- Loading speed. Each additional second reduces conversions by nearly 7%. A mobile Lighthouse score above 70 and an LCP (Largest Contentful Paint, the time taken to display the main content) below 2.5 seconds are the thresholds to reach. A slow website loses 20 to 30% of mobile conversions, a considerable loss for any SME whose traffic mostly comes from smartphones.
- Mobile usability. A technically "responsive" website is not necessarily usable on mobile. Small buttons, forms with multiple fields and complex menus cause abandonment that is invisible in aggregated data.
- Forms. Form abandonment reaches 81% without optimization. Reducing the number of fields, displaying clear error messages and offering autocomplete are three high-return actions.
- Copywriting and value proposition. Improving messaging generates conversion gains of 50 to 200%, compared with just 5 to 20% for visual changes. The message should answer the visitor's question within three seconds: "Why buy here rather than elsewhere?"
- Reassurance. Customer reviews, certifications, a clear returns policy and visible guarantees reduce purchasing friction. Their absence is one of the most common reasons for abandonment at the end of the funnel.
- Segmentation by source and device. Behavior differs substantially depending on whether the visitor arrives through a Google search, an ad or an email, and whether they use a computer or a phone. Optimization without segmentation hides critical problems affecting specific segments.
How should the audit adapt to an SME's size and resources?
The audit method adjusts to traffic volume and the available budget. A uniform approach does not suit every business.
Thresholds for A/B testing
A/B testing (comparing two versions of a page to measure which converts better) is often presented as the standard method. It is only reliable from around 100 conversions per variation per month. Below that threshold, the results have little statistical significance. Most microbusinesses and SMEs do not reach that volume on their key pages. Qualitative analysis then becomes the primary method, not a second-rate substitute.
Approach by traffic volume
| Monthly conversion volume | Recommended method | Action priority |
|---|---|---|
| Fewer than 50 | Qualitative analysis (replays, surveys) | Entry pages and forms |
| 50–100 | Qualitative analysis + segmented GA4 analysis | The complete funnel, prioritizing mobile |
| More than 100 | A/B tests on validated hypotheses | Pages with high traffic and high abandonment |
Frequency and cost
Ideally, a complete audit is carried out once or twice a year, with a light review each quarter. A 30-minute express audit focused on 3 to 5 key pages can provide five immediately actionable priority recommendations. For a complete professional audit, the cost ranges from €2,500 to €6,000, identifying an average of 12 to 20 points of friction, of which 3 to 5 generate conversion improvements above 8%.
Practical tip: Before commissioning a complete audit, go through a purchase on your own website using a smartphone you have never used before. Note every hesitation. This ten-minute test often reveals the most costly problems.
Which tools and metrics should you use to manage the audit?
A conversion audit relies on a set of complementary tools. Each answers a specific question.
- Google Analytics 4. The "Funnel exploration" and "Path exploration" reports show where visitors drop out and where they come from. Segmentation by device and traffic source is essential for reliable conclusions.
- Heatmap and session recording tools. Hotjar and Microsoft Clarity (the latter is free) record mouse movements, clicks and ignored areas. This visual data complements GA4 figures by showing visitors' actual behavior.
- Lighthouse and PageSpeed Insights. These Google tools measure pages' technical performance: overall score, LCP, CLS (Cumulative Layout Shift, meaning unexpected visual shifts) and FID (First Input Delay, the delay before the first interaction). They show precisely which technical fixes to prioritize.
- Surveys and feedback. A short questionnaire displayed when a visitor leaves a key page ("What stopped you from completing your order?") provides direct qualitative data. These answers focus the audit on the actual obstacles visitors perceive.
The key metrics to track are the overall conversion rate, cart or form abandonment rate, mobile conversion rate separated from desktop, mobile Lighthouse score and average order value. These five metrics explain the essentials of a website's conversion performance.
Lasting website improvement comes from a continuous loop: audit, improve, measure, then audit again. A custom GA4 dashboard, updated automatically, helps detect regressions quickly after each change.

Key points
An effective conversion audit depends on segmented data analysis, rigorous prioritization of actions and a continuous monitoring loop.
| Point | Details |
|---|---|
| Define the conversion first | Without a precise objective, no data can guide improvement decisions. |
| Prioritize 20% of pages | 80% of conversion problems are concentrated on a minority of high-traffic pages. |
| Prefer qualitative analysis below 100 conversions | Below this monthly threshold, A/B tests produce statistically unreliable results. |
| Address copywriting before design | Messaging gains reach 50 to 200%, compared with 5 to 20% for visual changes. |
| Measure continuously | A segmented GA4 dashboard detects regressions as soon as a change is deployed. |
What I see in practice with French SMEs
Most business leaders I meet start by wanting to redesign their website. That is understandable: visuals are tangible and easy to show a provider. But in almost every audit I have conducted, the main problem is not aesthetic. It is the message.
A homepage that talks about the company rather than the customer's problem converts poorly, whatever its visual design. An eight-field contact form on mobile causes heavy abandonment, even on a visually polished website. These problems can be solved in a few hours, not several weeks of redesign.
The other common mistake is launching A/B tests without sufficient volume. I have seen SMEs draw definitive conclusions from tests with 30 conversions per variation. The results were misleading and led to counterproductive decisions. When traffic is low, session recordings and exit surveys provide much more reliable insights.
What I consistently recommend: start with a visibility and performance audit before changing anything. Identify the three pages with the most abandonment. Fix the message first, then the technical issues, then the design. This sequence produces measurable results in a few weeks, not several months.
— Louis
Pharelia helps your SME improve its conversion rate
A conversion audit only produces lasting results when it is part of a coherent visibility strategy. Pharelia supports French microbusinesses and SMEs across the whole setup: analyzing technical obstacles, producing content that answers your buyers' questions, and monitoring performance through GA4 and Search Console.
Every Pharelia engagement starts with a free visibility audit based on crawl data, SERP data and mentions in AI search engines. This audit identifies priority friction points and the quickest conversion opportunities. The results achieved for clients such as Applewood (+300% SEO) illustrate what a structured, monitored approach delivers. For more detail, Pharelia's AI search optimization resources explain how organic visibility and conversion reinforce each other.
Frequently asked questions
What is a conversion audit (CRO audit)?
A conversion audit is a systematic analysis of a website that identifies obstacles preventing visitors from completing a target action (purchase, form submission, call). It combines quantitative data (GA4, Lighthouse) and qualitative data (session recordings, surveys).
How much does a professional CRO audit cost in France?
A professional CRO audit costs between €2,500 and €6,000. It identifies an average of 12 to 20 points of friction, of which 3 to 5 generate conversion improvements above 8%.
Are A/B tests suitable for small businesses?
A/B tests are only reliable from around 100 conversions per variation per month. Below this threshold, qualitative analysis (session replays, feedback) produces more relevant results at a lower cost.
How often should you conduct a conversion audit?
A complete audit is recommended once or twice a year, supplemented by a light review each quarter. A 30-minute express audit of 3 to 5 key pages is enough to identify the fastest improvements to implement.
What is the difference between a CRO audit and a UX audit?
A UX audit assesses the user's overall experience on the website. A CRO audit measures each element's direct impact on conversion. The two overlap, but a CRO audit focuses on commercial results, not ease of use.
Recommendation
- Supported sectors: SEO and AI visibility by industry · Pharelia
- Generating qualified leads: a guide for microbusinesses and SMEs | Pharelia
- SEO, GEO and AEO services | Pharelia
- SEO & AI agency for consulting firms and B2B services — Pharelia