
 Add to preferred sources on Google
 ChatGPT
 Claude
 Perplexity

Introduction
Content marketing ROI is (value attributed to content − content cost) ÷ content cost × 100. The formula is easy. The hard part is deciding what counts as cost, what counts as return, and how much of a deal your content can honestly claim. A number that survives a finance review needs a stated cost base, a stated attribution rule and a stated time window. A number without those is a guess with a percent sign.
This guide gives you the formula, a fully illustrative worked example, a way to grade your return by evidence, and a short diagnostic to run before you quote any ROI figure to leadership. It is written for B2B and ecommerce teams worldwide, so money examples are labeled with their currency and nothing here assumes one country’s rules.
TL;DR
- The formula: (attributed value − total content cost) ÷ total content cost × 100. A result of 0% is break-even, and 100% means the content returned twice its cost.
- Cost must include people, expert time, tools, distribution and maintenance, not just freelancer invoices. Return should use gross profit where you can, not raw revenue.
- In B2B, separate what is attributed, what is influenced and what is only inferred. Report them as three lines, never one blended number.
- Treat published “average ROI” benchmarks as conversation starters. Your own trend over several time horizons is the benchmark that matters.
- Do not quote a single figure before checking your attribution window against your real sales cycle.
The formula, and what the number means
The standard version, as Ahrefs states it, is ((return from content − cost of content) ÷ cost of content) × 100. Its own example: $10,000 in sales from content that cost $2,000 to create gives 400%. Ampere adds the reading guide: 100% means the content returned twice what it cost, 0% means break-even, and a negative figure means cost exceeded return in the period you measured.
Two mistakes show up constantly. The first is reporting a benefit-to-cost ratio as ROI. A ratio of 5:1 is a 400% ROI, not 500%, and Mindstamp flags this confusion as one of the common errors. The second is treating correlation as cause: traffic rose, revenue rose, so content did it. The same source notes that causal claims need comparison and timing evidence.
You can run the formula at three scopes, as G2 describes: the whole content program, a single campaign or a single piece. Choose the scope before you collect numbers. Program-level ROI is the most defensible with finance. Piece-level ROI is the most useful for editorial decisions, and also the noisiest.
ROI is not the same as performance reporting
Northbeam draws a distinction worth keeping: reporting tells you what happened, while measurement helps explain why and what to do next. It also separates three layers: activity metrics (how much you published), performance metrics (time on page, scroll depth, return visits) and business outcomes (pipeline influence, conversion lift, retention). ROI lives only in the third layer. A dashboard full of sessions and shares is reporting. It becomes ROI only when it connects to money.
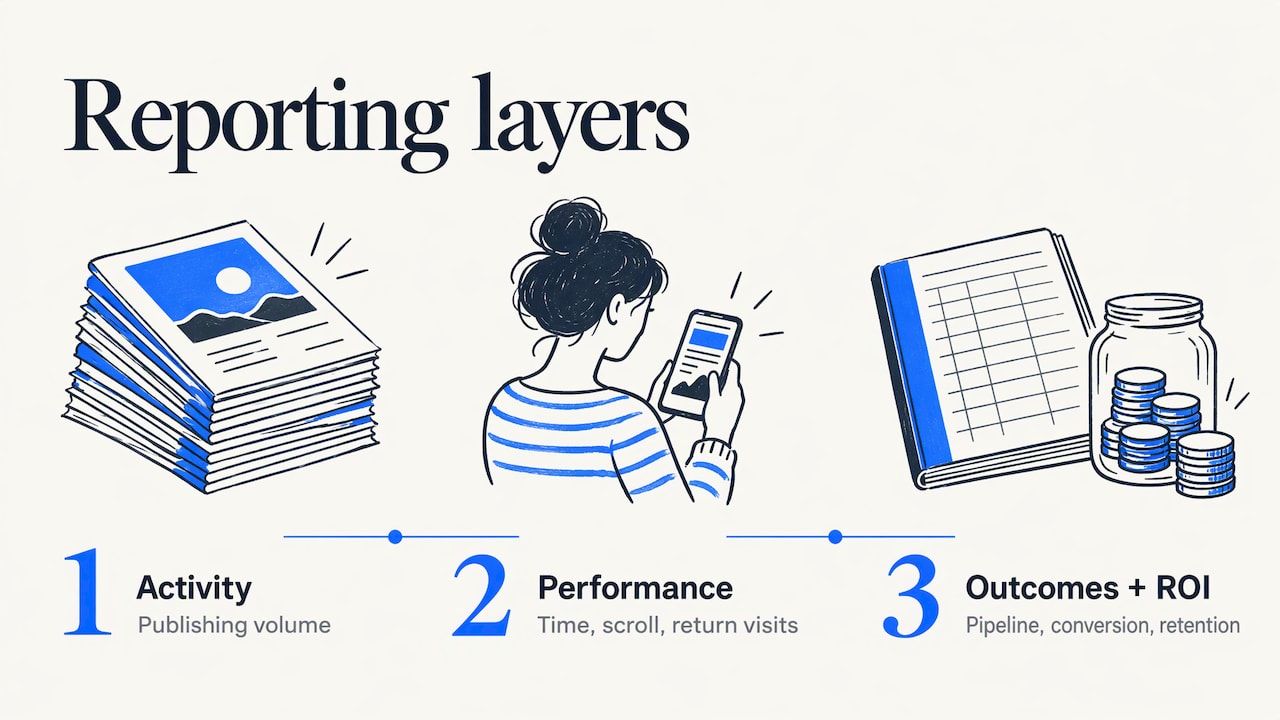
Our analysis: most of the “content ROI” slides that fail in budget meetings fail because they stay in layers one and two. Pageviews are a fine diagnostic and a poor justification.
A worked example (illustrative figures)
The numbers below are invented to show the mechanics. They are not a benchmark and not a client result. The currency is euros, chosen arbitrarily; swap in your own.
Imagine a B2B software company that spends twelve months on a content program.
| Cost line (illustrative) | Amount |
|---|---|
| Loaded in-house time: strategist and editor, 40% of two roles | €36,000 |
| Subject-matter expert interviews and reviews | €6,000 |
| Freelance writing and design | €18,000 |
| Tools (SEO, analytics, CMS add-ons) | €5,000 |
| Distribution (newsletter, small paid promotion) | €7,000 |
| Maintenance: refreshing older articles | €8,000 |
| Total cost | €80,000 |
Now the return side. Suppose the CRM shows 14 closed-won deals where content was the first or last recorded touch, with an average first-year gross profit of €13,000 each.
- Attributed gross profit: 14 × €13,000 = €182,000
- ROI = (€182,000 − €80,000) ÷ €80,000 × 100 = 127.5%
Now add a second tier. Say 20 further deals had a buying-group member read tracked content inside a defined window, worth €260,000 in gross profit combined. If your team agrees in advance to count 10% of influenced value, that adds €26,000. Then:
- Attributed plus partial influenced: €208,000
- ROI = (€208,000 − €80,000) ÷ €80,000 × 100 = 160%
Notice what changed. Nothing about the content moved. The ROI shifted 32 points purely because of a counting rule. That is why the rule must be written down before the results come in, and why the report should show both figures.
The same program, using revenue instead of gross profit
If the same deals were counted at revenue and the average deal carried a 50% gross margin (again, illustrative), the attributed revenue would be €364,000 and the ROI would show 355%. The program did not get better. The measurement just stopped subtracting the cost of delivering the product. Mindstamp argues for gross profit where possible for exactly this reason: revenue overstates the return.
What belongs in cost
The most common way to inflate ROI is to leave out cost nobody invoices. Ampere recommends including loaded internal people costs, subject-matter expert time, freelancers, production, tools, distribution and maintenance. Sitecore likewise says investment can include the overhead to create, distribute and reuse content assets.
A checklist to apply before calculating:
- Salaries at loaded rate , prorated by the share of time spent on content, not just headline pay.
- Expert time. Engineers, lawyers, consultants or product managers who are interviewed or who review drafts.
- External production. Writers, editors, designers, video, translation.
- Tools you would not need without the program.
- Distribution. Paid promotion, email platform, syndication.
- Maintenance. Updating and consolidating old pages is a real recurring cost, and ignoring it flatters the older content.
On the return side, decide whether you count direct revenue only or also customer lifetime value. Shopify notes that content can create value for existing customers too, which you can express through lifetime value. That is legitimate, but it must be a declared choice, not an afterthought added when the first number looked weak.
The traffic-value shortcut
When conversion data is thin, Ahrefs describes an approximation: monthly traffic value multiplied by the content’s lifetime in months, based on what you would have paid for the same visits through ads. We treat this as a floor-of-effort estimate for ranking content, not as revenue. It values visits, and a visit is not a lead. Use it to compare articles against each other, not to claim return to a CFO.
Attribution: who gets credit for the deal
Most visitors do not buy from the article they land on. Ahrefs notes that return typically depends on conversion tracking, such as form submissions or trial sign-ups. Google’s own documentation describes attribution as assigning credit for key events to the clicks and factors along a user’s path, and its reports offer data-driven, paid and organic last click, and Google paid channels last click models. Note what that implies: the default tooling is built around ad and click paths, and a buyer who read three of your guides, then asked a colleague, then typed your brand name into a search box leaves a thin trail.
The B2B problem has three parts.
Long cycles. ZoomInfo’s guide says B2B cycles run weeks to months, that standard 30-day windows miss early touches, and that a practical test is to check how many closed-won accounts had their first touch more than 90 days before opportunity creation. Heeet makes the same point bluntly: a 90-day window is no help when the average cycle is 365 days.
Buying groups. Several people from one account read different things at different times. Credit assigned to a single anonymous session misses this, so account-level views matter.
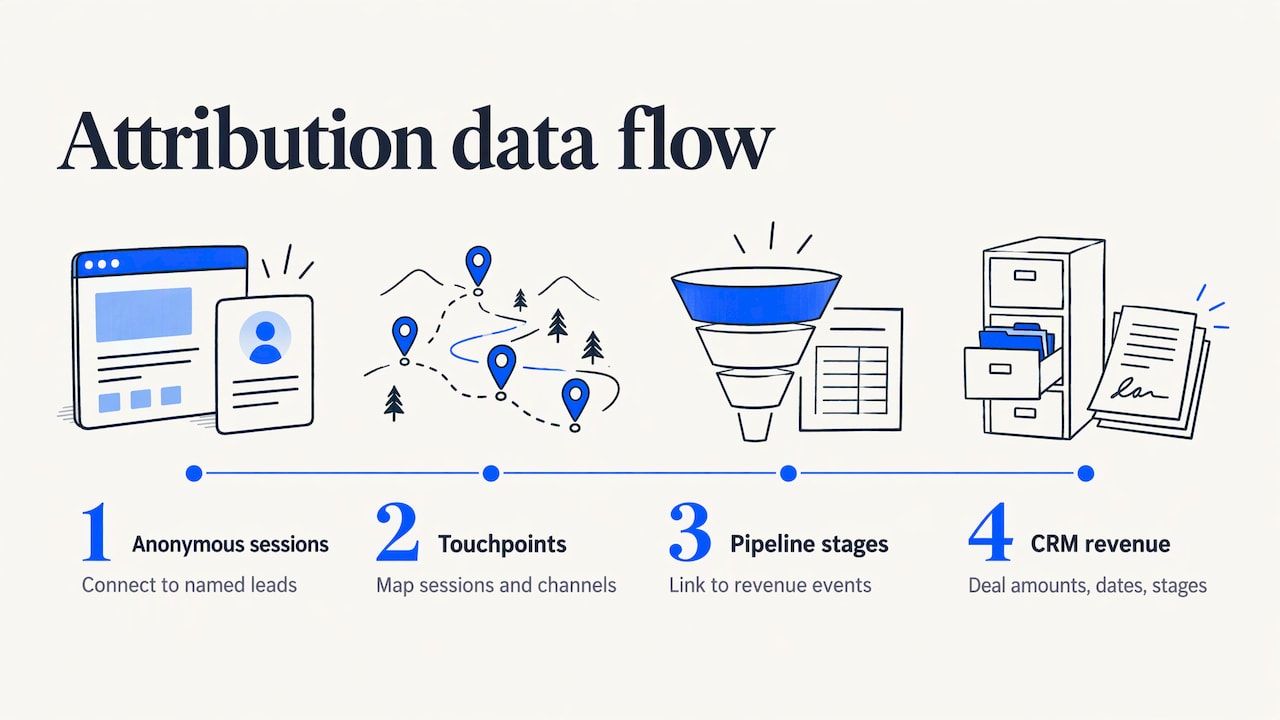
Two systems. Engagement data sits in analytics and revenue sits in the CRM. Cometly describes the needed work as connecting anonymous sessions to named lead records, mapping touchpoints across sessions and channels, and linking them to pipeline stages and revenue events. Marketing MBA argues the CRM should be the system of record for revenue because it holds deal amounts, close dates and stages.
All of these are vendor-published methods, not independent studies, and they have an interest in selling attribution tooling. The logic is sound, and the specific thresholds (30, 90, 365 days) are illustrations of why you should look at your own data rather than adopt someone’s default.
Grade the return by evidence
The most useful idea we found is Ampere’s evidence tiering. Rather than one blended figure, report three lines:
| Tier | What qualifies | How to count it |
|---|---|---|
| Attributed | Content was the first or last recorded touch on a conversion | Count in full |
| Influenced | A buying-group member engaged with tracked content within a defined window | Count a pre-agreed share |
| Inferred | Indirect signals: branded search growth, dark social, AI answer visibility | Report separately, never add to the ROI |
This is a method from one vendor, not a standard, but we think it is the right instinct. It keeps the defensible number defensible and still gives credit to effects you can see but cannot prove.
A related discipline: keep AI mentions, citations, clicks, visits, enquiries and revenue as separate rows. An AI answer naming your brand is a mention. A link inside that answer is a citation. A person following it is a click, and only an enquiry tied to a deal is revenue. Merging them produces a story that sounds good and measures nothing.
Metrics by funnel stage
ROI is the end of a chain. The earlier links tell you where the chain is weak. Northbeam suggests tracking awareness, engagement, consideration, conversion influence and retention or expansion. Search Engine Watch proposes a similar top, middle and bottom view for B2B. Combined into one working table (our synthesis):
| Stage | Useful signals | Question it answers |
|---|---|---|
| Awareness | New visitors, branded search, early-touch discovery | Are the right people finding us? |
| Engagement | Return visits, scroll depth, time on page | Is the content worth reading? |
| Consideration | Returning direct visitors, downloads, content sequences | Are readers going deeper? |
| Conversion | Leads, demo requests, assisted conversions, pipeline touch rate | Does content move people to act? |
| Retention | Existing customers using enablement content | Does content protect revenue we already have? |
CMI’s 2025 B2B benchmark report shows why the stage matters. Among 980 surveyed B2B marketers, 87% said content helped create brand awareness, 74% said it helped generate demand or leads, and 49% said it helped generate sales or revenue. In plain terms, content is most often credited at the top of the funnel and least often at revenue. If your ROI formula looks only at revenue, you are measuring the stage where content gets the least direct credit.
What counts as a good ROI?
Search this and you will find confident numbers. One roundup claims an average return of $7.65 for every $1 spent and a median SEO ROI of 748% over three years. Others publish industry ranges, such as 400 to 600% over three years for SaaS. We do not use these as targets, for four reasons.
- Method is rarely visible. Most such figures come from vendor roundups that do not publish sample, cost definition or attribution rule, so you cannot tell whether two numbers measure the same thing.
- Survivorship. Teams that measure and publish tend to be the ones that did well.
- Cost definitions differ. An ROI that ignores internal salaries is not comparable to one that includes them.
- Time horizons differ. Content compounds. A 12-month snapshot and a 36-month figure describe different things, a point Northbeam makes when it advises extending windows for evergreen content and tracking several horizons.
In the same vein, the claim that content generates three times the leads of outbound at 62% lower cost circulates widely, and we could not trace it to a primary study. Treat it as marketing copy until you can.
Our analysis: a “good” ROI is one that is positive on your own cost base, improving over successive quarters and above what the same budget would earn in your next-best channel. That third comparison is the one a CFO actually cares about.
Hollow advice worth retiring
A few habits we think deserve gentle mockery.
- “Track everything.” Fifty metrics with no decision attached is a hobby. Pick the five that change what you do next quarter.
- “Social shares prove value.” G2 frames ROI as contribution to business goals tied to substantial KPIs such as leads or recurring revenue, not vanity metrics. A share is not a sale.
- “Last-click tells the truth.” It tells you where the final click happened. For a six-month B2B cycle that is usually a branded search or a direct visit, which flatters whatever came last.
- “ROI should be positive in month three.” Content assets accumulate. Judging an evergreen guide by its first quarter is like judging a new office by its first week of rent.
- “Use the industry average.” See above.
A diagnostic to run before you quote a number
Work through these in order. If you cannot answer one, fix it before presenting an ROI.
- Define the scope. Program, campaign or piece?
- Write the cost base. Use the six-line checklist above and get finance to sign off on salary loading.
- Choose gross profit or revenue , and say which.
- Check your cycle. Pull closed-won deals and compare first content touch with opportunity creation and close. Set your window from that data.
- Connect analytics to the CRM. If a form submission cannot be traced to a deal record, you can only measure up to the lead.
- Declare the influence rule. Which share of influenced value counts, and who agreed?
- Report three tiers : attributed, influenced, inferred.
- Review quarterly. Sprout Social recommends validating attribution models and revenue links each quarter, and describes incrementality testing, which compares exposed and control groups, as a way to measure lift.
- Document assumptions. Northbeam advises consistent, repeatable frameworks with written assumptions and limitations. Future you will need them.
A small caveat on incrementality: it needs enough volume to produce a meaningful comparison. For a team closing a handful of enterprise deals a year, a clean control group may simply not exist. In that case, lean on the tiered report and on trend over time rather than forcing a test the data cannot support.
Our perspective
Most content ROI disputes are really disputes about definitions. When leadership distrusts the number, it is rarely the arithmetic. It is that cost was understated, credit was generous and nobody wrote the rules down. Our view at Pharelia is that content only earns budget when it is planned backwards from a commercial question: which buyers, which decisions, which pages. That is why we treat strategy, production, optimization and measurement as one connected piece of work rather than four separate invoices. It is also why we think measurement belongs at the start of an engagement, not as a report appended at the end. We would also argue for restraint. Tell your leadership what is attributed, what is influenced and what is inferred. A smaller number that holds up is worth more than a large one that collapses at the first question. We do not guarantee results, rankings or citations, and we would be suspicious of any provider that does. Louis Choquet
Where outside help makes sense
If your team can run the diagnostic above in-house, do. If the blockers are structural, such as content produced without a strategy, analytics disconnected from the CRM or no one owning maintenance, a managed engagement can help. Our SEO/GEO measurement and performance tracking work sits alongside strategy, production and optimization, and scope, deliverables and budget are defined in a proposal after initial scoping. Pricing is available on request. You can describe your situation through our contact page.
Sources
- Ahrefs: Content Marketing ROI
- Ampere: How to measure content marketing ROI
- Mindstamp: Content Marketing ROI
- G2: How to Measure Content Marketing ROI
- Northbeam: How to Measure Content Marketing ROI
- Sitecore: The ROI of content marketing
- Shopify: Content ROI
- Google Analytics Help: Get started with attribution
- ZoomInfo: B2B Marketing Attribution
- Heeet: B2B Marketing Attribution
- Cometly: Attribution For Content Marketing
- Marketing MBA: Marketing Attribution for B2B
- Search Engine Watch: Content marketing metrics for B2B companies
- Content Marketing Institute: B2B Content Marketing Benchmarks 2025
- Omnibound: Content Marketing ROI Statistics
- Sprout Social: Content marketing ROI
Recommended
Frequently asked questions
What is the formula for content marketing ROI?
Subtract total content cost from the value attributed to content, divide by total content cost, and multiply by 100. With $10,000 of attributed sales and $2,000 of cost, the result is 400%, the example Ahrefs uses. Decide in advance whether value means revenue or gross profit, because the choice changes the answer.
How do I measure content marketing ROI when sales cycles are long?
Set your attribution window from your own closed-won data, not from a default. Connect analytics sessions to CRM records so you can follow contacts through to revenue, and review results at several time horizons. For cycles of many months, report influenced pipeline as its own line instead of waiting for last-touch credit.
Should I use revenue or profit in the calculation?
Gross profit is the safer choice when you have it, since revenue ignores the cost of delivering what was sold and makes ROI look larger. If you can only use revenue, label it clearly and keep the same basis every period so trends stay comparable.
What is a good content marketing ROI?
There is no reliable universal figure. Published averages vary in cost definition, time horizon and sample, so they are not comparable with each other or with your numbers. A practical standard is a positive ROI on a full cost base that improves over time and compares well with your alternative uses of the budget.
Can I measure the impact of AI answers on ROI?
Partly. Mentions and citations in AI answers are worth tracking, but they usually sit in the inferred tier because the path to a deal is indirect. Report them separately from clicks, visits, enquiries and revenue, and add to attributed ROI only what you can trace to a recorded conversion.