# PageSpeed Insights: a practical guide for professionals in 2026
Discover how PageSpeed can transform your website's performance in 2026. Improve your Google rankings and stop losing visitors!
Author: Louis Choquet · Founder, Pharelia
Published on 2026-07-25 · Updated on 2026-08-09
Source: https://pharelia.com/en/resources/pagespeed
## Introduction

PageSpeed Insights (PSI) is Google's own web performance analysis tool, available free at pagespeed.web.dev. It evaluates any URL's loading speed and produces a report structured around [Core Web Vitals](https://developers.google.com/search/docs/appearance/core-web-vitals): the official user experience quality indicators Google has incorporated into its ranking algorithm since 2021.
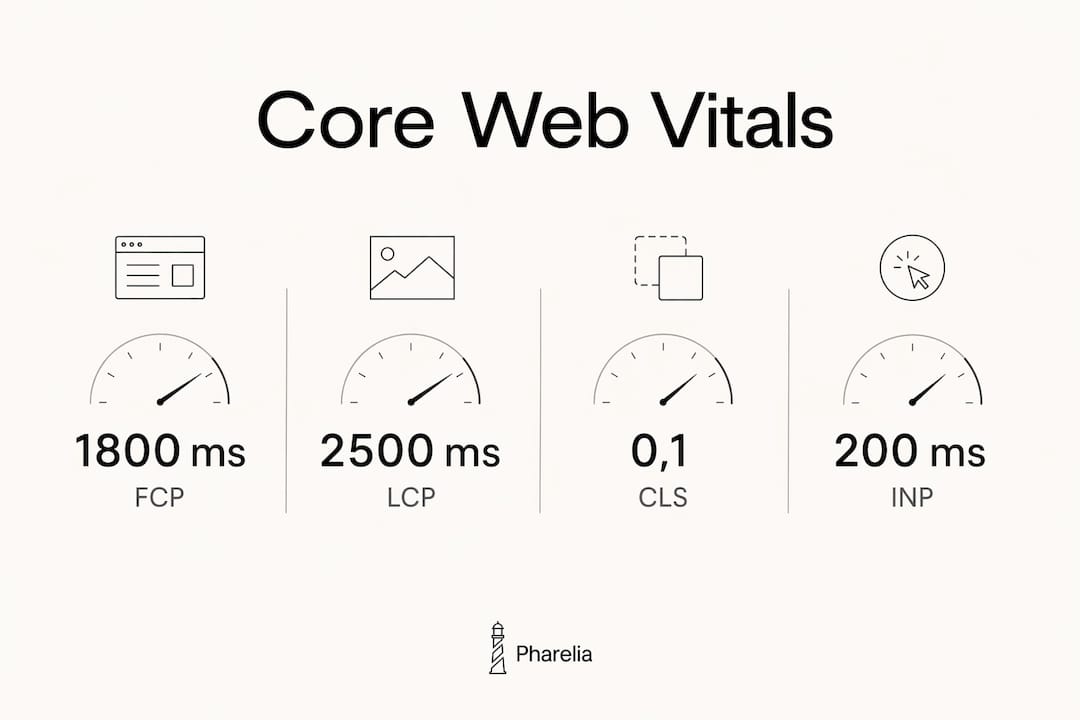
For web professionals and business owners in 2026, mastering this tool is no longer optional. A slow website loses visitors before displaying its content, and Google takes this into account in rankings. The thresholds in Google's official 2025 documentation are precise:
- **FCP (First Contentful Paint)**: ≤ 1 800 ms to be rated ‘good’
- **LCP (Largest Contentful Paint)**: ≤ 2 500 ms for good performance
- **CLS (Cumulative Layout Shift)**: ≤ 0,1 for good visual stability
- **INP (Interaction to Next Paint)**: ≤ 200 ms for good responsiveness
After 3 seconds without visible content, [you lose visitors](https://developer.mozilla.org/fr/docs/Web/Performance/Guides/How_long_is_too_long) who probably will not return. This is the critical threshold not to cross, whatever your sector.
## Table of contents
- [How do you use PageSpeed Insights to audit your website?](#comment-utiliser-pagespeed-insights-pour-auditer-votre-site)
- [How should you interpret the report's detailed metrics?](#comment-interpreter-les-metriques-detaillees-du-rapport)
- [Which measures improve your website's speed?](#quels-leviers-activer-pour-ameliorer-la-vitesse-de-votre-site)
- [Loading speed and organic search: what is the connection in 2026?](#vitesse-de-chargement-et-referencement-naturel-quel-lien-en-2026)
- [What are PageSpeed Insights' limitations?](#quelles-sont-les-limites-de-pagespeed-insights)
- [What Pharelia observes in practice in France](#ce-que-pharelia-observe-sur-le-terrain-en-france)
- [Perceived and actual speed: a distinction that changes everything](#vitesse-percue-et-vitesse-reelle-une-distinction-qui-change-tout)
- [LCP, CLS and INP: the three Core Web Vitals to monitor first](#lcp-cls-et-inp-les-trois-core-web-vitals-a-surveiller-en-priorite)
- [How should you monitor your website's speed regularly?](#comment-surveiller-la-vitesse-de-votre-site-de-facon-reguliere)
- [Pharelia optimizes your technical performance and online visibility](#pharelia-optimise-votre-performance-technique-et-votre-visibilite-en-ligne)
- [Key takeaways](#points-cles)
- [Frequently asked questions](#questions-frequentes)
## How do you use PageSpeed Insights to audit your website?
Access is immediate: go to pagespeed.web.dev, paste the URL to analyse, choose mobile or desktop, then start the analysis. The report appears within seconds.
**What you get:**
- An overall performance score from 0 to 100, calculated by Lighthouse
- Field data from the Chrome User Experience Report (CrUX), reflecting users' actual experience over the last 28 days
- Lab data simulated under controlled conditions, useful for diagnosis
- Additional sections: Accessibility, Best Practices, SEO
The distinction between lab and field data is fundamental. Lab data reproduces a standardised environment; it is reproducible and useful for identifying specific regressions. Field data aggregates your visitors' actual experiences at the 75th percentile, meaning 75 % had an experience at least as good as the displayed value.
**For comparisons over time:**
1. Always test the same key URLs (homepage, conversion pages, high-traffic articles)
2. Record scores before and after every deployment
3. Analyse mobile and desktop separately, as results often differ
4. Cross-check with Google Search Console to track Core Web Vitals across the website
## How should you interpret the report's detailed metrics?
PSI classifies every indicator using three colours: green (good), orange (needs improvement), red (poor). This colour classification enables quick reading, but detailed interpretation requires understanding what each metric measures.

| Metric | Good | Needs improvement | Poor |
| --- | --- | --- | --- |
| FCP | good | needs improvement | poor |
| LCP | good | needs improvement | poor |
| CLS | good | needs improvement | poor |
| INP | good | needs improvement | poor |
**What each indicator reveals in practice:**
- **FCP** measures when the first visual element appears on screen. A slow FCP often indicates a slow server or blocking resources at the start of the document.
- **LCP** targets the largest visible viewport element: a hero image or main text block. It is the indicator most directly connected to the user's perception of speed.
- **CLS** quantifies unexpected visual shifts during loading. A high CLS means moving buttons, jumping text and an experience perceived as unstable.
- **INP** has replaced FID (First Input Delay) since March 2024. It measures overall interaction responsiveness throughout the session, not only the first click.
- **TTFB (Time to First Byte)** remains an experimental indicator in PSI, but is directly linked to hosting quality and server response time.
## Which measures improve your website's speed?
Image quality is almost always the first obstacle identified. Switching to WebP or AVIF, compressing without visible quality loss and sizing images to their actual display dimensions can reduce page weight by 40 to 60 % in typical cases.
**Image optimization:**
- Convert to WebP or AVIF rather than JPEG/PNG
- Use `srcset` to serve the right resolution for the screen
- Enable lazy loading (`loading="lazy"`) for images outside the viewport
**Hosting and server response time:**
High-performance hosting directly reduces TTFB. On low-end shared hosting, a high TTFB often drags down every other indicator, regardless of front-end optimizations. Moving to better hosting or enabling a server cache such as LiteSpeed Cache often produces the quickest gains.
**CSS, JavaScript and HTML resources:**
- Minify CSS and JavaScript files (tools: Terser, CSSNano)
- Defer non-critical scripts with `defer` or `async`
- Remove unused CSS with PurgeCSS
- Enable Gzip or Brotli compression on the server
**Distribution and caching:**
- Deploy a CDN (content delivery network) to serve static resources from servers geographically close to your visitors
- Configure appropriate HTTP cache headers for stable resources
**Pro tip:** *Use Google Search Console alongside PSI to monitor Core Web Vitals across your entire domain, not just manually tested URLs. The ‘Page Experience’ report aggregates field data across all indexed pages.*

## Loading speed and organic search: what is the connection in 2026?
Google has officially incorporated Core Web Vitals into its algorithm as a ranking signal. Google's message is clear: optimization must serve the user experience first; the technical score is an indicator, not an end in itself.
In practice, a website with Core Web Vitals in the red suffers a measurable competitive disadvantage on queries where several equally good pages compete for top positions. Speed then becomes the deciding factor.
**Observed effects on traffic and conversions:**
- Poor LCP can increase bounce rates, reducing the engagement signals Google interprets
- High CLS can cause accidental clicks and abandonment, particularly on mobile
- Positive Core Web Vitals correlate with better visitor retention and higher conversion rates
Mobile speed deserves special attention: Google prioritises the mobile version of your pages for indexing. An excellent desktop score alongside a poor mobile score does not protect your rankings.
## What are PageSpeed Insights' limitations?
PSI is a diagnostic tool, not an oracle. Its limitations are documented and must be understood to avoid costly interpretation errors.
**Main limitations:**
- Field data is unavailable for new or little-visited pages. In that case, PSI switches to origin-level data or displays no real data at all, making the report less actionable.
- A good lab score does not guarantee a good actual experience. Simulated conditions do not reproduce the diversity of your real visitors' devices, connections and behaviour.
- PSI tests one URL at a time. It does not detect performance problems appearing only on particular pages or under particular load conditions.
- Scores vary between analyses even without website changes, due to fluctuations in the network and third-party resources.
**For a complete picture:**
- Cross-check PSI with Google Search Console (the ‘Page Experience’ report)
- Use GA4 to measure the actual impact on user behaviour
- Test regularly from several geographical locations
**Pro tip:** *PSI's lab data relies on Lighthouse, which simulates a mid-range mobile device on a slow 4G connection. If your audience mainly uses desktops and fibre connections, this test profile may overstate actual problems. Always interpret lab data alongside field data when available.*
## What Pharelia observes in practice in France
Pharelia's accumulated experience across dozens of French websites confirms that the most significant speed gains rarely come from one action. They result from coordinated technical optimization, hosting quality and content structure.
> Speed optimization is not a one-off project. It is ongoing work that must be part of every deployment, theme update and plugin addition. Websites maintaining good Core Web Vitals over time treat performance as a development requirement, not an after-the-fact fix.
In the [Applewood client case study](https://pharelia.com/en/client-work/applewood), Pharelia achieved +300 % SEO traffic and +500 % visibility in generative engines by working simultaneously on technical performance, content structure and internal linking. Speed was one of the initial obstacles identified in the audit.
**Practical recommendations for web professionals in France:**
- Conduct a complete performance audit before any redesign or migration
- Check that your host offers servers in Europe to minimise latency
- Include Core Web Vitals in the acceptance criteria for every technical delivery
- Do not sacrifice content quality for a score: Google explicitly says user experience comes first
**Pro tip:** *For WordPress websites, caching plugins (WP Rocket, W3 Total Cache) combined with a CDN such as Cloudflare cover most optimizations possible without changing code. This is the most cost-effective starting point for an SME.*
**Steps in a structured speed audit:**
1. Run PSI on the website's 5 to 10 most strategic URLs
2. Identify metrics in the red and priority opportunities flagged by Lighthouse
3. Fix images first (format, compression, dimensions)
4. Improve hosting or enable server caching
5. Minify and defer non-critical JavaScript and CSS resources
6. Check the impact in Search Console 28 days after the fixes
## Perceived and actual speed: a distinction that changes everything
One website can load in 4 seconds and feel instant. Another can load in 2 seconds and seem slow. The difference is perceived speed, which depends on what users see first rather than total loading time.
FCP and LCP measure precisely this perceptual dimension. Quickly displaying the main content, even while secondary elements still load in the background, creates an impression of responsiveness. Techniques prioritising visible content (inline critical CSS, preloading key resources with ``) serve this exact purpose.
Skeleton loading, which displays grey blocks while waiting for actual content, is another common way to reduce perceived waiting without changing actual loading time. The goal is not only to be fast but to feel fast from the first milliseconds.
## LCP, CLS and INP: the three Core Web Vitals to monitor first
Core Web Vitals are the three indicators Google considers most representative of the actual user experience. They replaced older metrics (particularly FID) to better reflect the variety of modern interactions.
**LCP (Largest Contentful Paint)** targets the loading of the page's dominant element. On most websites, this is a hero image or a heading block. Optimizing LCP means preloading that element, avoiding loading it through CSS or JavaScript, and ensuring a quick server response.
**CLS (Cumulative Layout Shift)** penalises unexpected visual shifts. The most common causes are images without declared dimensions, ads inserted into the flow, and web fonts replacing system fonts with different dimensions. Explicitly declaring `width` and `height` on every image eliminates most CLS problems.
**INP (Interaction to Next Paint)** measures the delay between a user action (clicking, typing) and the corresponding visual update. High INP often reveals a main thread overloaded with heavy JavaScript. Splitting long tasks and reducing third-party JavaScript are the most effective measures.
## How should you monitor your website's speed regularly?
A one-off PSI analysis provides a snapshot. Continuous monitoring detects regressions before they affect search visibility or conversions.
Google Search Console remains the starting point: the ‘Page Experience’ report aggregates CrUX data across the domain and flags degraded URLs. To go further, tools such as Lighthouse CI integrate automated performance tests directly into your deployment pipeline so regressions are detected before going live.
For high-traffic websites, tracking real metrics through GA4 (with web performance events) usefully supplements Search Console's aggregated data. Cross-checking the two sources reveals whether performance deterioration coincides with a conversion-rate drop on a particular page. [Page speed directly affects conversions](https://blog.forliveshopping.es/blog/tasa-de-conversion-en-tiktok-shop-guia-2026), a point marketing teams often underestimate compared with technical teams.
## Pharelia optimizes your technical performance and online visibility
Fixing a website's Core Web Vitals is often the first step in wider visibility work. Pharelia handles technical performance alongside SEO, GEO and AEO under one contract, without a restrictive annual subscription.
[](https://pharelia.com/en/contact)
Every engagement starts with a [free visibility audit](https://pharelia.com/en/resources/audit-seo-checklist) covering technical obstacles (Core Web Vitals, indexing, structured data), Google ranking analysis and citations in generative engines such as ChatGPT, Perplexity and Gemini. For French microbusinesses, SMEs and startups seeking measurable results, Pharelia handles what eleven separate subscriptions usually cover. Consult the SEO, GEO and AEO resources to understand how technical performance and AI visibility connect, or [contact us](/en/contact).
## Key takeaways
PageSpeed Insights is the reference tool for diagnosing loading speed and aligning technical performance with organic search.
| Point | Details |
| --- | --- |
| Core Web Vitals thresholds for 2025 | FCP ≤ 1 800 ms, LCP ≤ 2 500 ms, CLS ≤ 0,1, INP ≤ 200 ms according to Google. |
| Lab versus field data | Field data (CrUX, 75th percentile) reflects actual experience; lab data is for diagnosis. |
| First optimization priority | Images (WebP/AVIF format, compression, declared dimensions) are almost always the main obstacle. |
| Continuous monitoring | Cross-check PSI with Search Console and GA4 to detect regressions before they affect SEO. |
| Pharelia | Pharelia fixes technical obstacles (Core Web Vitals, indexing) and handles SEO, GEO and AEO under one contract. |
## Frequently asked questions
### What exactly is PageSpeed Insights?
PageSpeed Insights is a free Google tool analysing a web page's speed and performance, combining simulated data (Lighthouse) with real data from the Chrome User Experience Report.
### Does a score of 100 guarantee good search rankings?
No. Google reminds us that a score is an indicator, not an end in itself. A website with good content often outranks one with poor content, regardless of the technical score.
### Why is my field data missing in PSI?
Field data appears only if enough Chrome users have visited the page over the last 28 days. For new or low-traffic pages, PSI switches to origin-level data or displays nothing.
### What is the difference between FID and INP?
FID (First Input Delay) measured only the delay on the first click. INP (Interaction to Next Paint), which replaced it in March 2024, measures responsiveness throughout the session, making it much more representative of actual experience.
### How does Pharelia incorporate technical performance into its engagements?
Pharelia treats Core Web Vitals as a prerequisite for any visibility strategy: a slow or poorly indexed website reduces its chances of appearing in Google and generative AI answers. The initial audit always covers these technical points.
## Recommendation
- [SEO boost for microbusinesses and SMEs: the 2026 guide | Pharelia](https://pharelia.com/en/resources/boost-seo-pour-tpe-et-pme-le-guide-2026)
- [ChatGPT search visibility in 2026: a practitioner's guide | Pharelia](https://pharelia.com/en/resources/referencement-chatgpt)
- [Advanced Google search: a practical 2026 guide | Pharelia](https://pharelia.com/en/resources/recherche-avancee-google-guide-pratique-2026)
- [Why a steady publishing schedule beats perfection in SEO | Pharelia](https://pharelia.com/en/resources/moteur-de-contenu-cadence)